Rethinking 80/20
We often describe empirically distribution inequalities with statements such as “80% of stock concentrates on 20% of population”. While there are many ways to divide the distribution and its allocated stock in two groups, not all of these ways are equally informative. We developed a metric to describe inequality that splits the population and the total stock in two homogenous groups, each with a different concentration of the stock, such that the mean, variance, and skewness of the two homogenous groups are the same as the mean, variance, and skewness of the initial population.
Live Maps
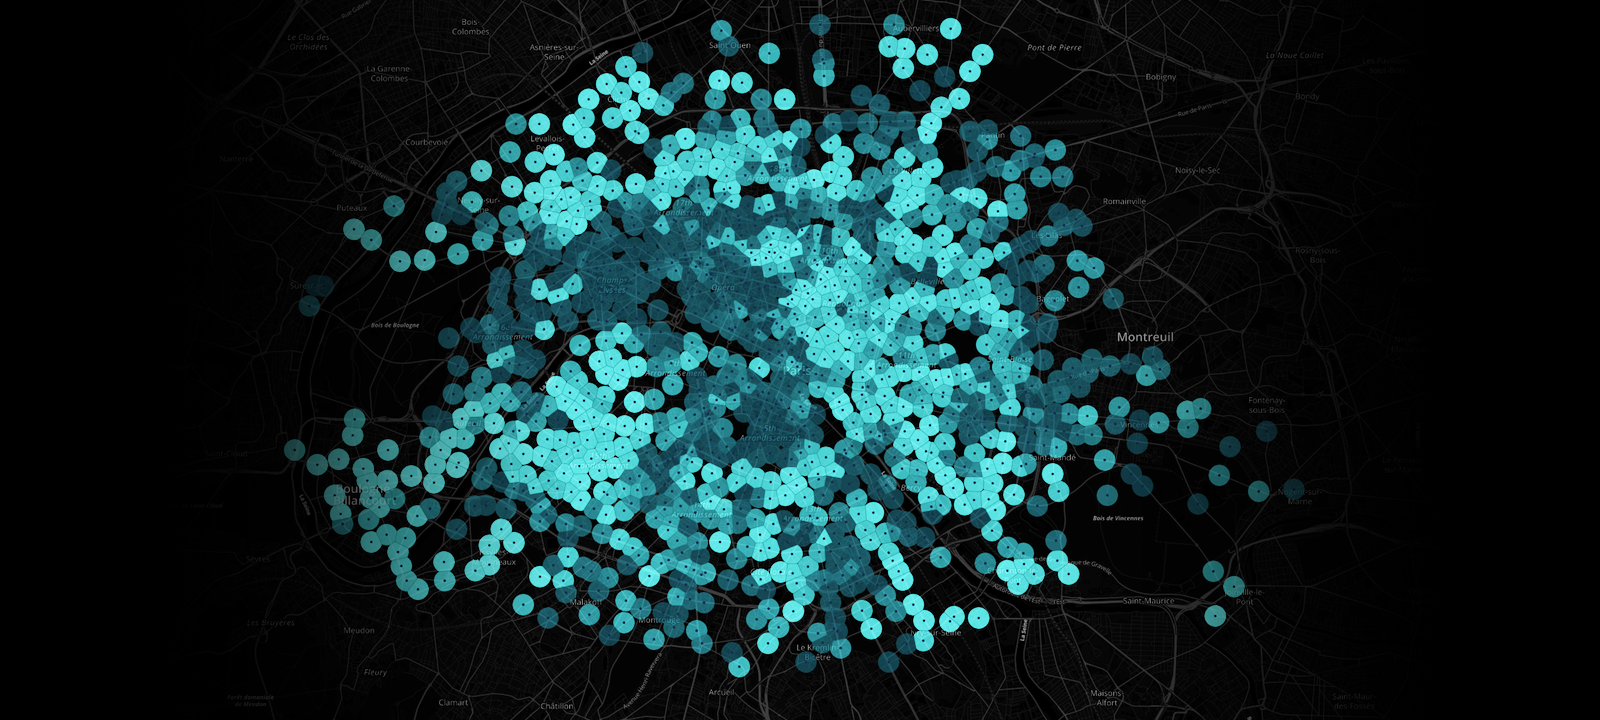
The following maps display live data from inventory levels of 20 bike sharing systems around the world. Each column contains: 1) a map with the distribution of station locations with light tones indicating stations in the "high inventory level" group and dark tones indicating stations in the "low inventory level" group; 2) a visualization of the distribution of the inventories as two continuous compartments; 3) ordered based on inventory level; 4) ordered based on station index; and 5) the Gini coefficient.
Modeling discrete distributions with compartment models
In studying dynamic systems with compartment models, it is essential to describe inequality of continuous or discrete distributions in as few compartments as possible. For example, in the field of System Dynamics, diffusion processes are often modeled with only two compartments.
Discrete distributions are described by standardized central moments about the mean. In most cases, we use the first three standardized moments: the mean, the variance, and the skewness. Here, we divide a distribution in two continuous sets such that the first three standrardized models are the same in both descriptions.
The index allows to model a discrete distribution, with two continuous compartments, given a mean, variance, and skew consisting. For example, a modeler may enter as inputs X1, X2, mean, variance, and skewness, and get the Y1 and Y2 from the model. Alternatively, a modeler may enter as inputs Y1, Y2, mean, variance, and skewness, and get in return the X1 and X2 shares of the population from the model.